Using Ediphi's Excel Add-in (Last Mile)
Since every estimator works in Excel, Ediphi is making it easier to bridge the gap between Excel and our platform. The Ediphi Excel Add-in provides a customizable and user-friendly way to access and manage your reporting needs directly within Excel.
In this article, we'll walk through the different tabs of the Add-in and share tips and tricks to help streamline your workflow.
Learn more about how to install the Ediphi Add-in here.
In this article
Data Tab
The first tab you'll see after logging into the Ediphi Add-in is the Data tab, showcasing the project list. After selecting a project and an estimate, the next page serves as a dashboard, displaying key information like the project name, estimate name, Total Cost, Area, and Cost per SF. From here, you can open the estimate directly in your browser by clicking on the New Tab icon, or if you see any discrepancies between the Ediphi platform and the Add-in, refresh the Add-in data by clicking the blue Refresh icon.
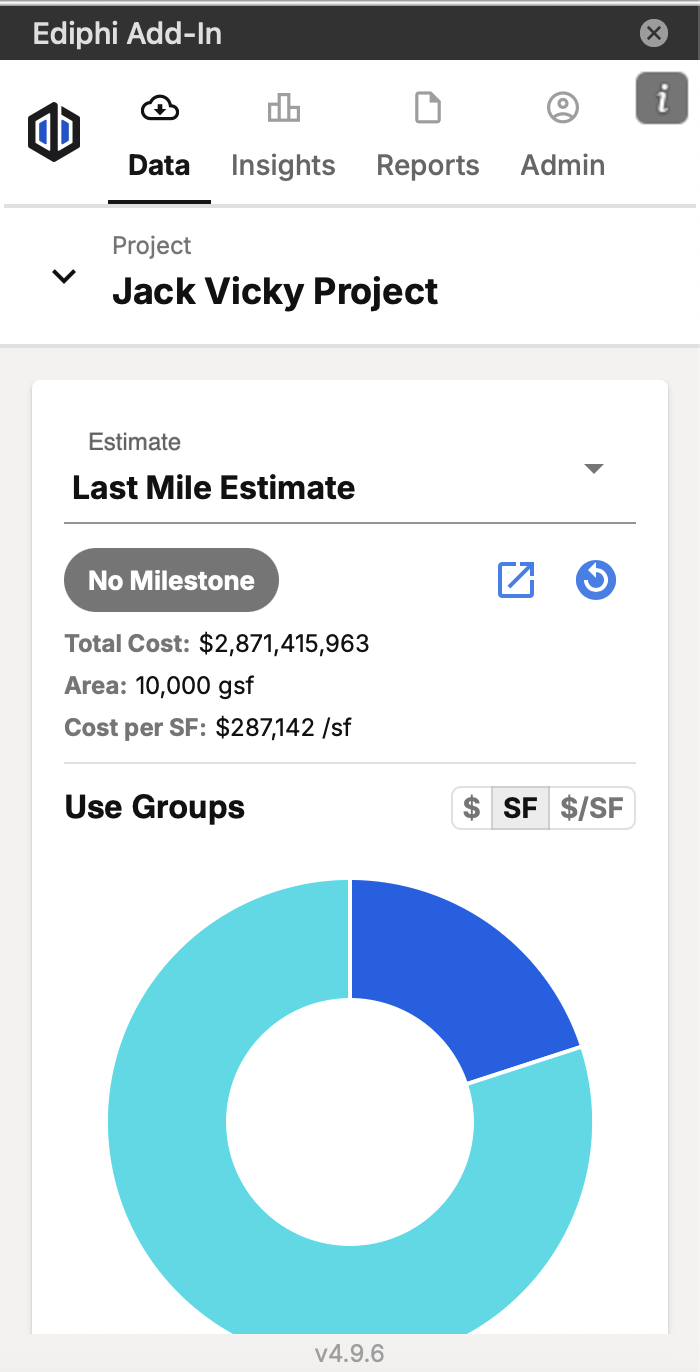
The pie chart visually represents each Use Group in the estimate. Each "slice" shows that group's share of the Total Cost, Area, or Cost per SF. Use the tabs in the top-right corner to toggle between these three views.

Pro Tip: Loading the Ediphi Add-in will keep pre-existing worksheets and will not delete any prior Excel work you have already completed.
Insights Tab
If you're looking to visualize your data through charts, the Insights tab in the Ediphi Add-in is the place to go. It includes four pre-built charts designed to help you better understand and manage your data.
- First, navigate to the Insights tab within the Ediphi Add-in and select Add Chart.

- Under the "Add Chart" modal, click a chart you wish to generate on your current Excel worksheet. This will automatically populate visual charts, which include your Ediphi project data.

- After choosing a chart, it will load and populate on the current Excel worksheet you have open. You can then drag and drop the chart anywhere on the sheet and resize it.

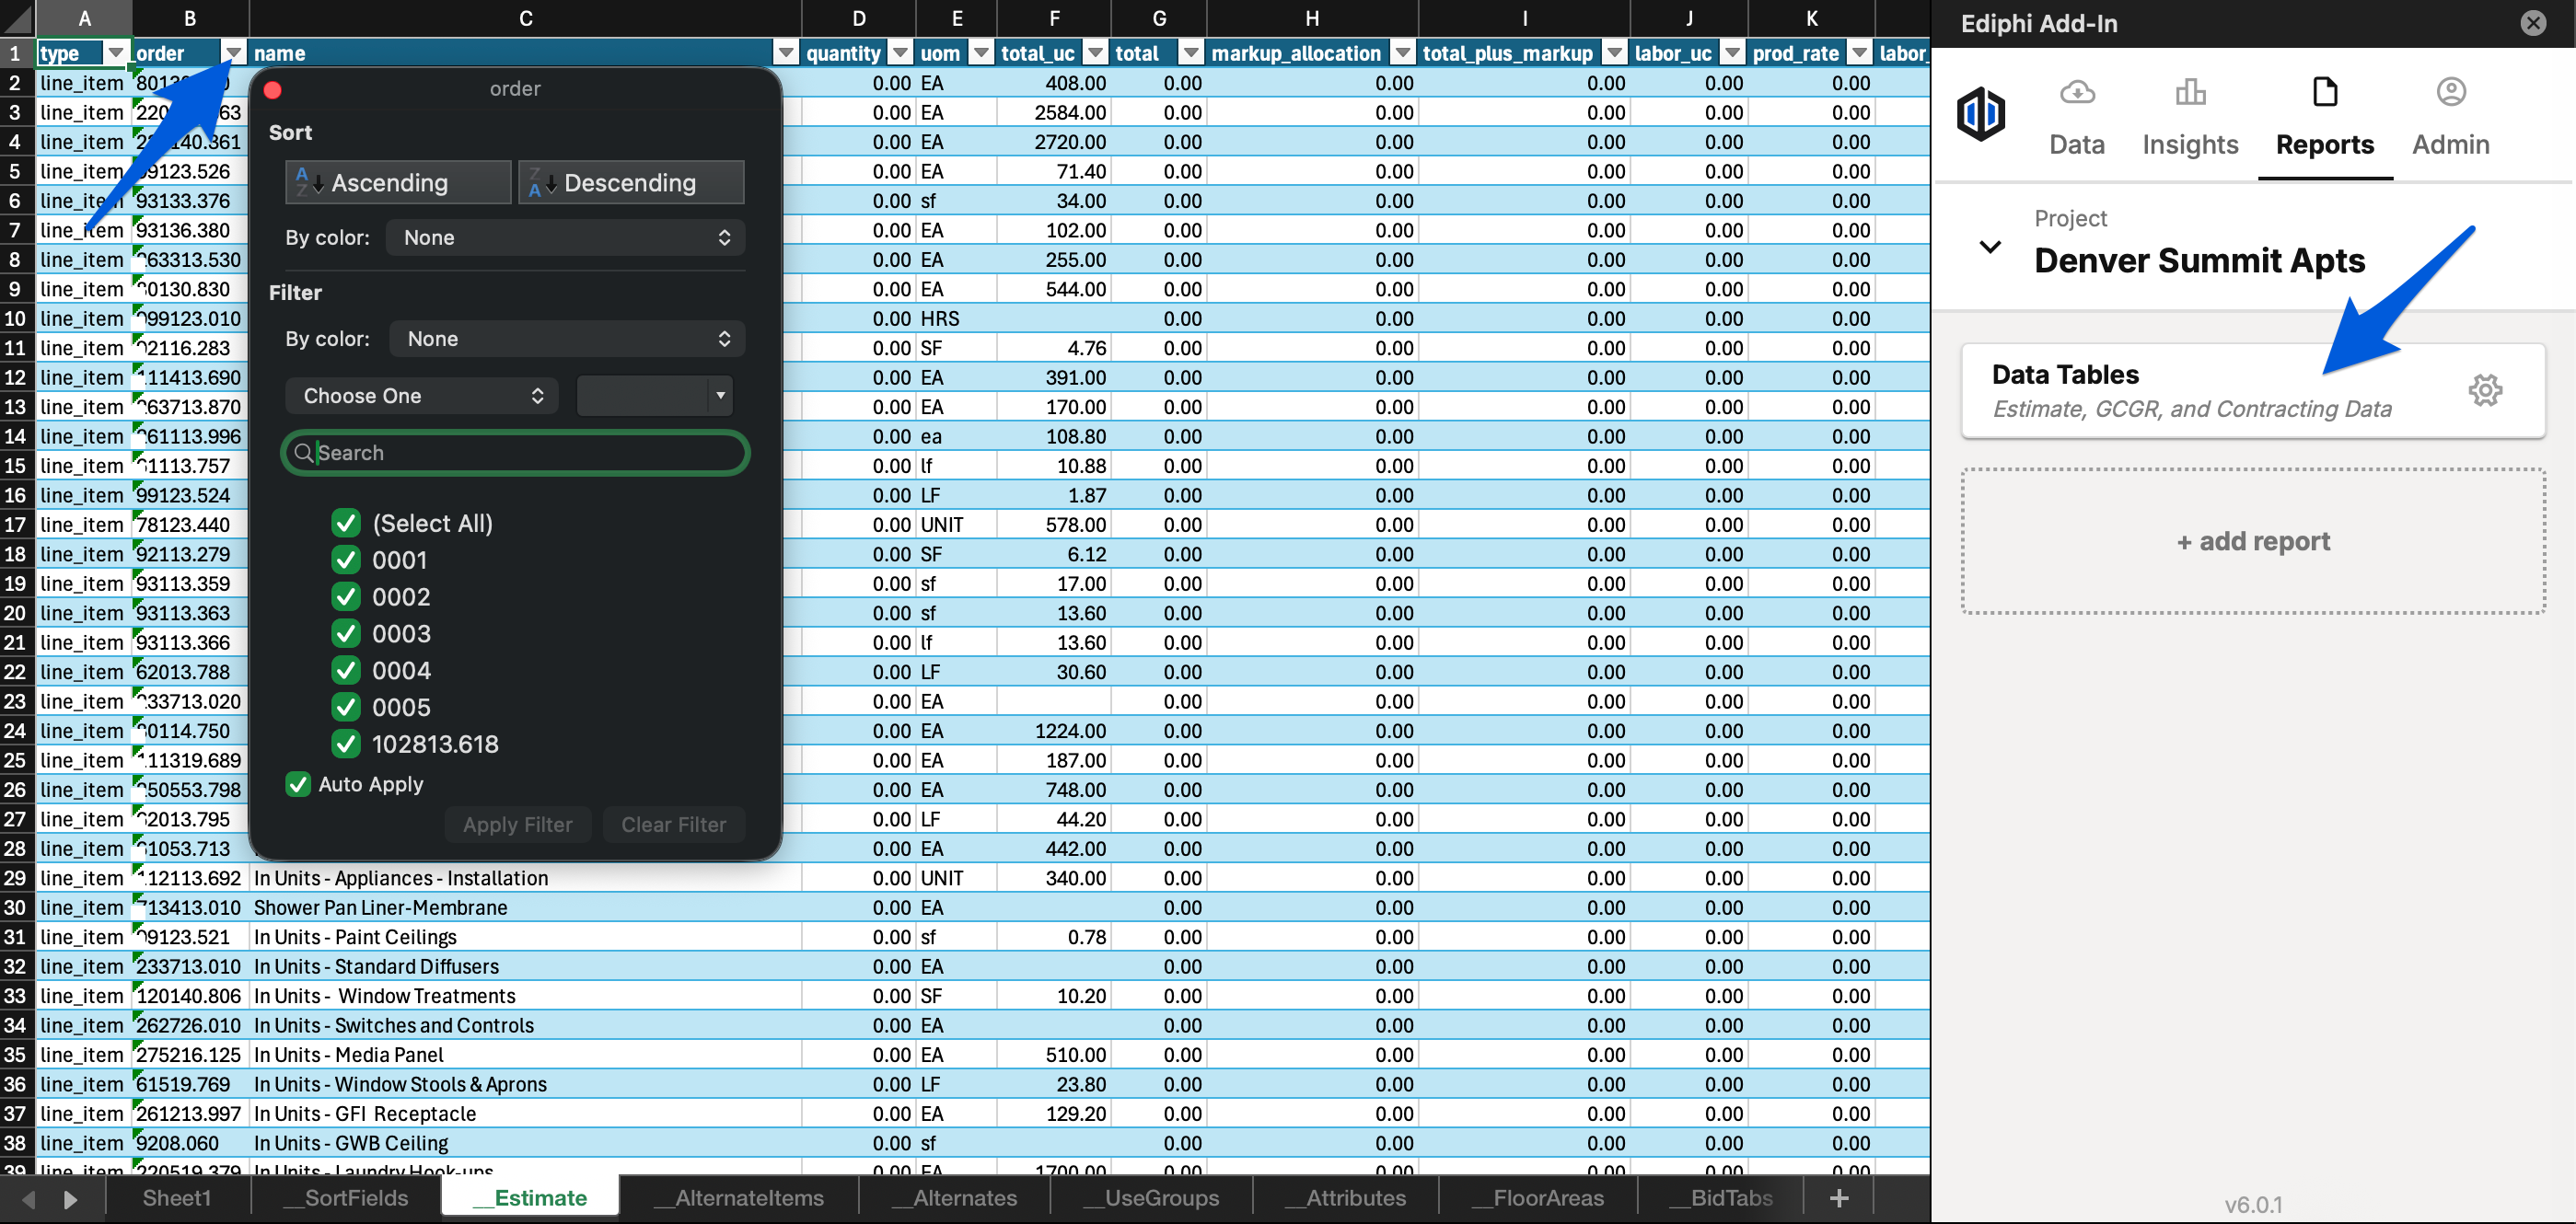
Reports Tab
The Reports tab in the Ediphi Add-in allows users to build automated reports in Excel using live data from the Ediphi platform. This enables quick and easy access to project data for customized reporting directly within your spreadsheet.
- First, navigate to the Reports tab within the Ediphi Add-in and select Add Report.

- Under the "Create Report" modal, click on each report you wish to run. This will automatically populate a full report with your Ediphi project data.

Note: Ediphi Add-in GCGR Reports will not populate until you mark a GCGR as Active in the Ediphi platform.

- When clicking on a report, an Excel worksheet will populate with the relevant data from that report. The selected report will be listed within the Ediphi Add-in along with any other reports you generate.

Pro Tip: If you click on a report and receive an error, double-check that the required data exists in the Ediphi platform. For example, the VM Decisions Estimate report will return an error if no VM Decisions are linked to any line items in your estimate.
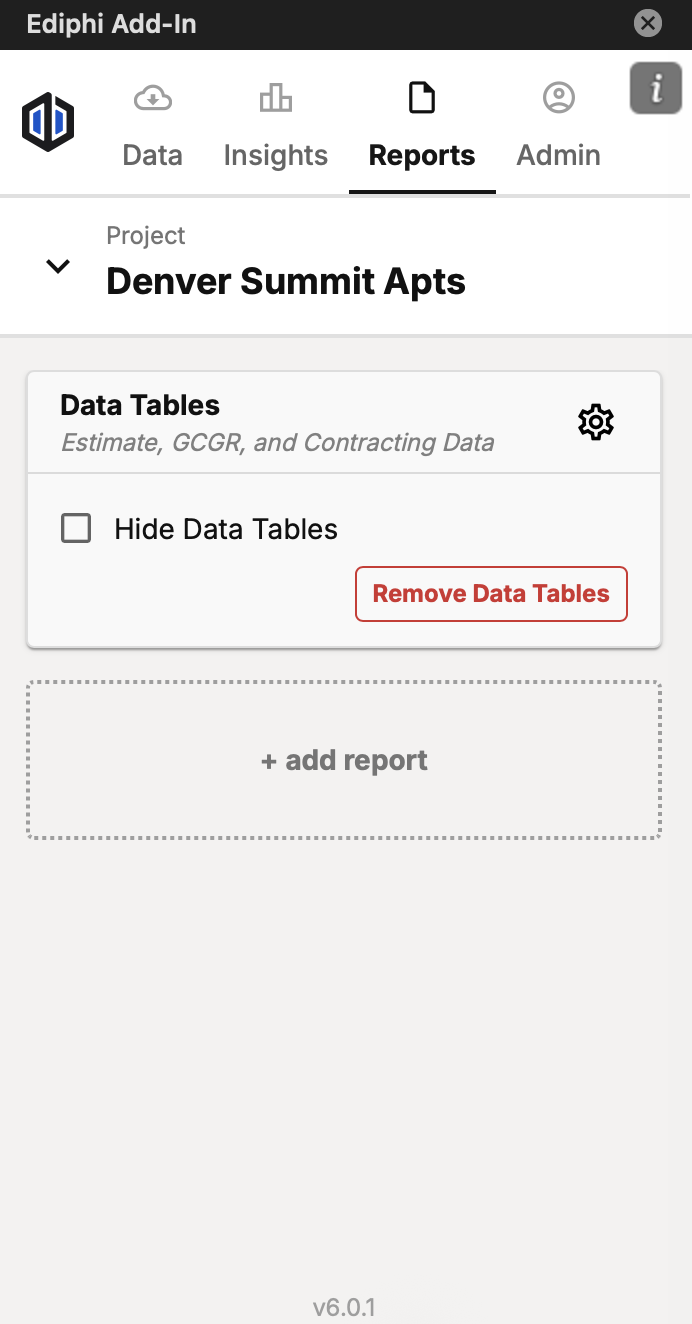
Note: If you would like to see your project's data worksheets, run the Data Tables report. This report will reveal the data worksheet tabs at the bottom of your Excel workbook. These tabs represent different parts of your project, such as Sort Fields, Use Groups, Floor Areas, Report, Bid Tabs, GCGRs, and more.
If you click to remove the data tables, this will cause any custom reports referencing this data to break.
Admin Tab
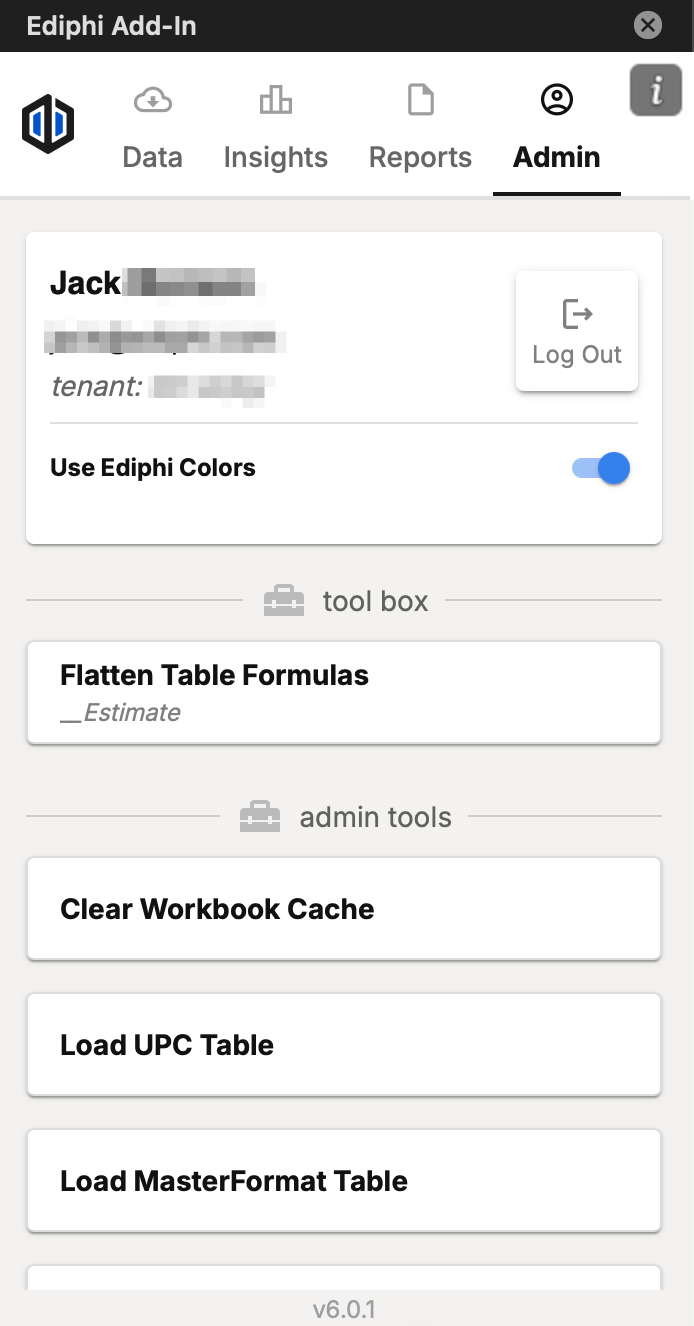
The final tab in the Ediphi Add-in is the Admin tab, a toolbox for managing hidden data sheets and workbook settings. Here, you'll find your login information, a toggle to apply Ediphi Colors to charts, and an option to Flatten Table Formulas. Below those settings are key Admin tools: Clear Workbook Cache, Load UPC, MF, UF, and Users Tables.
Use Ediphi Colors
Use the toggle next to Use Ediphi Colors to apply Ediphi’s standard color scheme to charts in the Insights tab.
Flatten Table Formulas
If you hover your mouse over the information icon, you will see that this will create a copy of the current worksheet, but flatten all of the formulas linked to the ediphi data tables. This is often used before sending out an owner bid form.
Clear Workbook Cache
This will clear your project and estimate IDs, report selections, and any data worksheets (if previously enabled). It's especially useful if your Excel file becomes linked to the wrong project and you want to switch to a different one without logging out and back in.
Load UPC Table
This option loads a new worksheet containing the Unit Price Catalog (UPC) data table for the region associated with your selected project.
To load the global UPC data table instead, skip selecting a project or estimate when logging in. Then, go straight to the Admin tab and click Load UPC Table.
Load MasterFormat Table
This option loads a new worksheet containing all levels of your MF sort fields/codes.
Load Uniformat Table
This option loads a new worksheet containing all levels of your UF sort fields/codes.
Load Users Table
This option loads a new worksheet containing all users added to your Ediphi company account.
Tips & Tricks
- To refresh a report in the Ediphi Add-in, simply click the report name, and the worksheet will reload with the latest data.

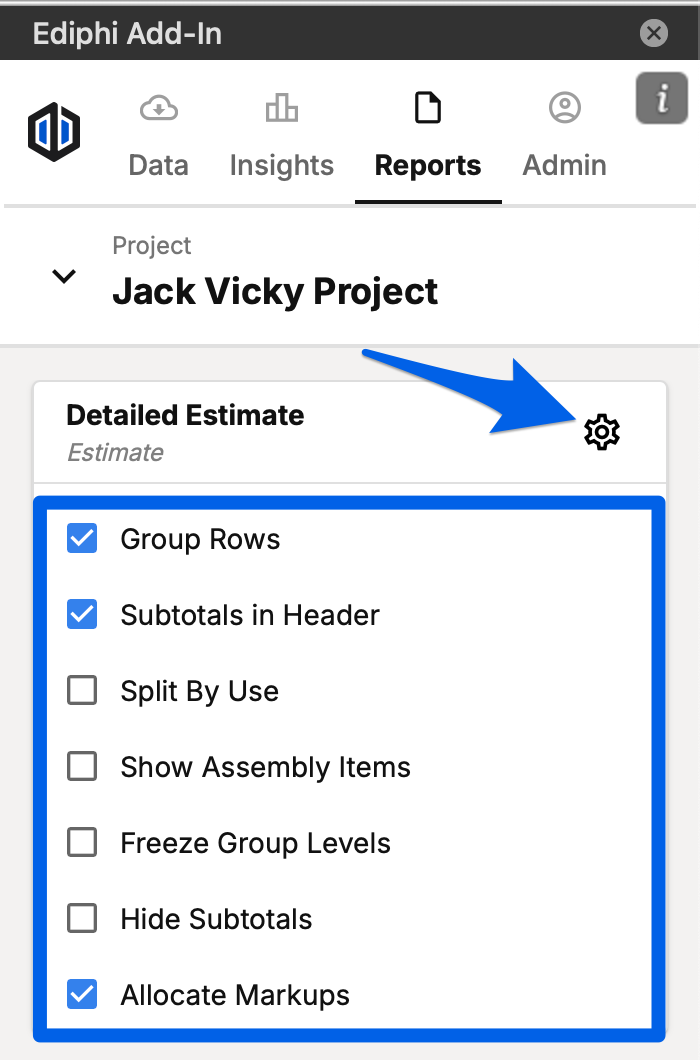
- Click the cog icon in any report to further customize how the report is displayed. After making changes, click the report name again to apply and view the updates.
- Group Rows: Adds Excel outline levels so rows can be collapsed by group.
- Subtotals in Header: Moves group subtotals to the header row instead of using a blank spacer row.
- Split By Use: When grouping by Use Group, this option separates your Use Groups (even if they share line items), unlike the default grouping in the Ediphi platform.
- Show Assembly Items: Displays child items that are part of an assembly.
- Freeze Group Levels: Locks the current grouping structure in place.
- Hide Subtotals: Hides all but level-1 subtotals; ideal for simplifying long reports.
- Allocate Markups:
- If you have Above the Line markups in Ediphi and you have Allocate Markups selected, the report will allocate those Above the Line markup costs within the cost of work.
- If you have Above the Line markups in Ediphi, and you have Allocate Markups unselected, the report will treat the Above the Line markups as Below the Line markups.
- To remove a report from the Ediphi Add-in, right-click the Worksheet tab at the bottom and select Delete. To refresh the list of available reports in the Add-in, simply click to another tab and then return to the Reports tab; the list will update automatically.

- When viewing the Data Table tabs, use the arrows (carrots) at the top of each column to filter and narrow down the information you're looking for.
- Closing the Ediphi Add-in will automatically log you out, requiring you to sign in again. If you just want to create more space in your worksheet, we recommend zooming out in Excel instead of closing the Add-in.

If you have any questions, feel free to contact our support team, and we'll be happy to help!