Historical Pricing
At Ediphi, we know that accurate unit costs are the foundation of a reliable estimate. The Historical Pricing modal gives estimators a fast, data-driven way to validate the costs they're using by pulling in real pricing data from past projects, all without ever leaving their current estimate.
Whether you're building a conceptual estimate or finalizing a GMP, this tool helps you answer the core question: Is this a good unit cost to use for this scope of work on this project?
In This Article
- How to Access Historical Pricing
- Understanding the Data
- Relevance Scoring
- Filtering
- Scatter / Box & Whisker Chart
- Escalation
- Columns & Table Customization
- Updating Your Unit Cost
- FAQs
How to Access Historical Pricing
From any line item in your estimate that’s linked to your UPC, right-click on the row and select Historical Pricing. This opens the modal in the context of that specific line item, so all data shown is scoped to applications of that same line item across different estimates.

Understanding the Data
Before any results appear, Ediphi automatically applies a set of background filters to ensure the data you see is meaningful. These run silently and cannot be turned off:
- Archived projects are excluded.
- Mismatched units of measure (UoM) are excluded; only lines with matching UoMs are shown.
- Zeros and negative values are excluded.
- Text overrides: if a total value has been entered as text rather than a number, it will be excluded.
- Your own project's line items are excluded.
These filters exist to remove noise and ensure every line item shown has legitimate pricing data worth evaluating.
Relevance Scoring
Each historical line item is assigned a Relevance score that reflects how closely it matches your current line item. This helps surface the most comparable data at the top of your list.

Relevance is calculated across several factors:
- Design Stage: Lines from more advanced design stages (e.g., Construction Documents or GMP) are ranked higher, as they represent firmer, more reliable pricing.
- Recency: More recently modified lines score higher.
- Region: Lines from the same Region as your current project are weighted more favorably.
- Similar Quantity: Quantities closer to yours are more relevant, since economies of scale affect unit cost.
- Use Groups: Lines from matching use groups score higher.
Relevance is broken into three tiers: Good, Neutral, and Weak. By default, Weak results are filtered out, but you can enable them using the filter controls.

The table defaults to sorting by relevance, with Good matches at the top.
Note: This feature is currently in beta. The result shown is Ediphi’s best recommendation based on the available information, but it should be treated as guidance rather than a definitive answer.

Filtering
In addition to the always-on background filters, you can apply your own filters to narrow the dataset down to the most apples-to-apples comparisons for your specific situation: by project, Region, relevance tier, or other available columns.
Scatter / Box & Whisker Chart
The Scatter graph at the top of the modal gives you a visual read on the data. You can toggle the X-axis between two views:
-
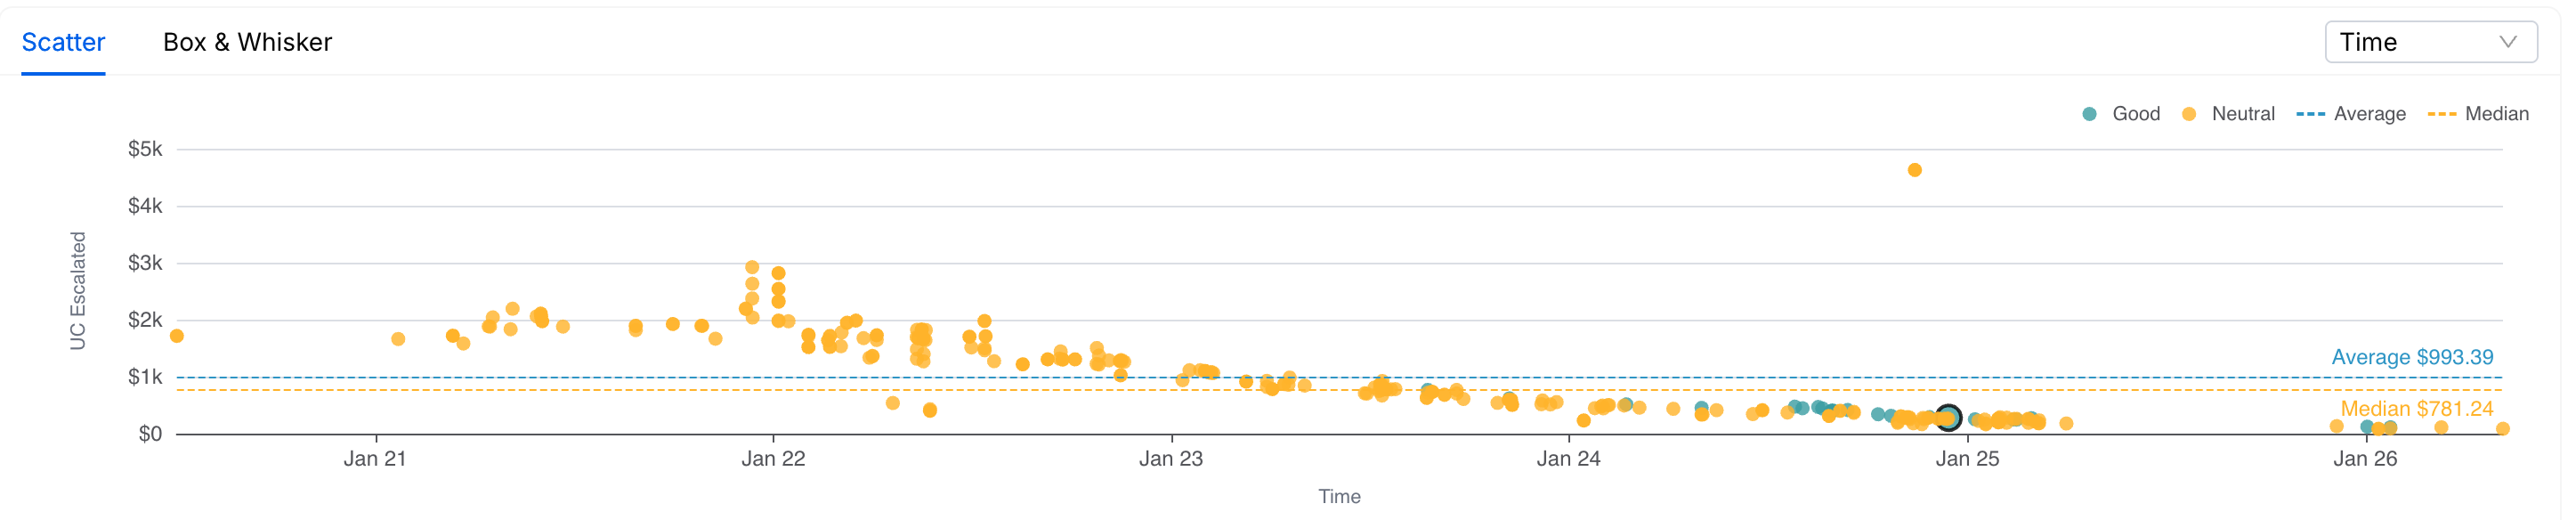
Time: Plots unit cost over time, helping you identify pricing trends. If escalation is enabled ($ UC Escalated), expect to see a relatively flat line (since costs are normalized to today). Toggle escalation off (select $ Unit Cost) to see the raw trend.
-
Quantity: Plots unit cost against quantity, helping you understand economies of scale. Higher quantities typically correspond to lower unit costs.

Clicking on a point in the graph will highlight and take you to the corresponding row in the table below, making it easy to cross-reference.
Your preferred X-axis selection saves to your User Settings and persists across sessions.
Switching to the Box & Whisker chart helps you understand the distribution of prices across your filtered dataset.
It displays:
- Minimum price
- Maximum price
- First quartile (Q1)
- Third quartile (Q3)
- Median price
This is especially useful once you've applied filters and want to understand what the most commonly used price looks like across comparable lines. The chart updates dynamically as your filters change.

Escalation
Escalation is enabled by default and adjusts historical unit costs to account for both time and region differences, the same way escalation works in Cost Modeling.
How it works:
- The start date for each line's escalation is when that line was last modified.
- The end date defaults to today.
- Escalation rates pull from your organization's admin escalation table. If no configuration has been set, rates default to zero.
Time and Region escalation are both included. Region escalation accounts for cost differences between where a historical line was built and where your current project is located.

The modal shows two unit cost columns side by side:
- UC (Escalated): The cost adjusted for time and Region. This is what the graph always reflects.
- Unit Cost (Original): The raw historical value, unadjusted.

You can always select which cost you’d like to see by clicking on the toggles next to Manage Escalation. This will save to your User Settings and carry over across projects. If you manually adjust escalation rates within the modal, those overrides also persist across all your projects until cleared.

Note: If you notice greyed out values in your Manage Escalation, it means it’s pulling the data from your company's escalation table for Time and Region. Otherwise, the values will show zero. You can always modify these values as needed (per project).

Columns & Table Customization
The table includes a wide range of columns to give you full context on each historical line. For example, standard pricing fields, project metadata, and even notes from the original line item.

You can customize your view:
- Show/hide columns: Toggle columns on or off to focus on what matters most
- Reorder columns: Drag columns to rearrange them
- Sort: Click any column header to sort ascending or descending
Column visibility and ordering save to your User Settings and persist across sessions, regardless of which line item you open the modal from.
Pro Tip: Each line item row has a link that opens the source project or estimate in a new tab so you can review the full context of a historical line if needed.

Updating Your Unit Cost
Once you've reviewed the data and landed on a price you want to use, you can update your line item directly from within the modal; no need to close it first.
-
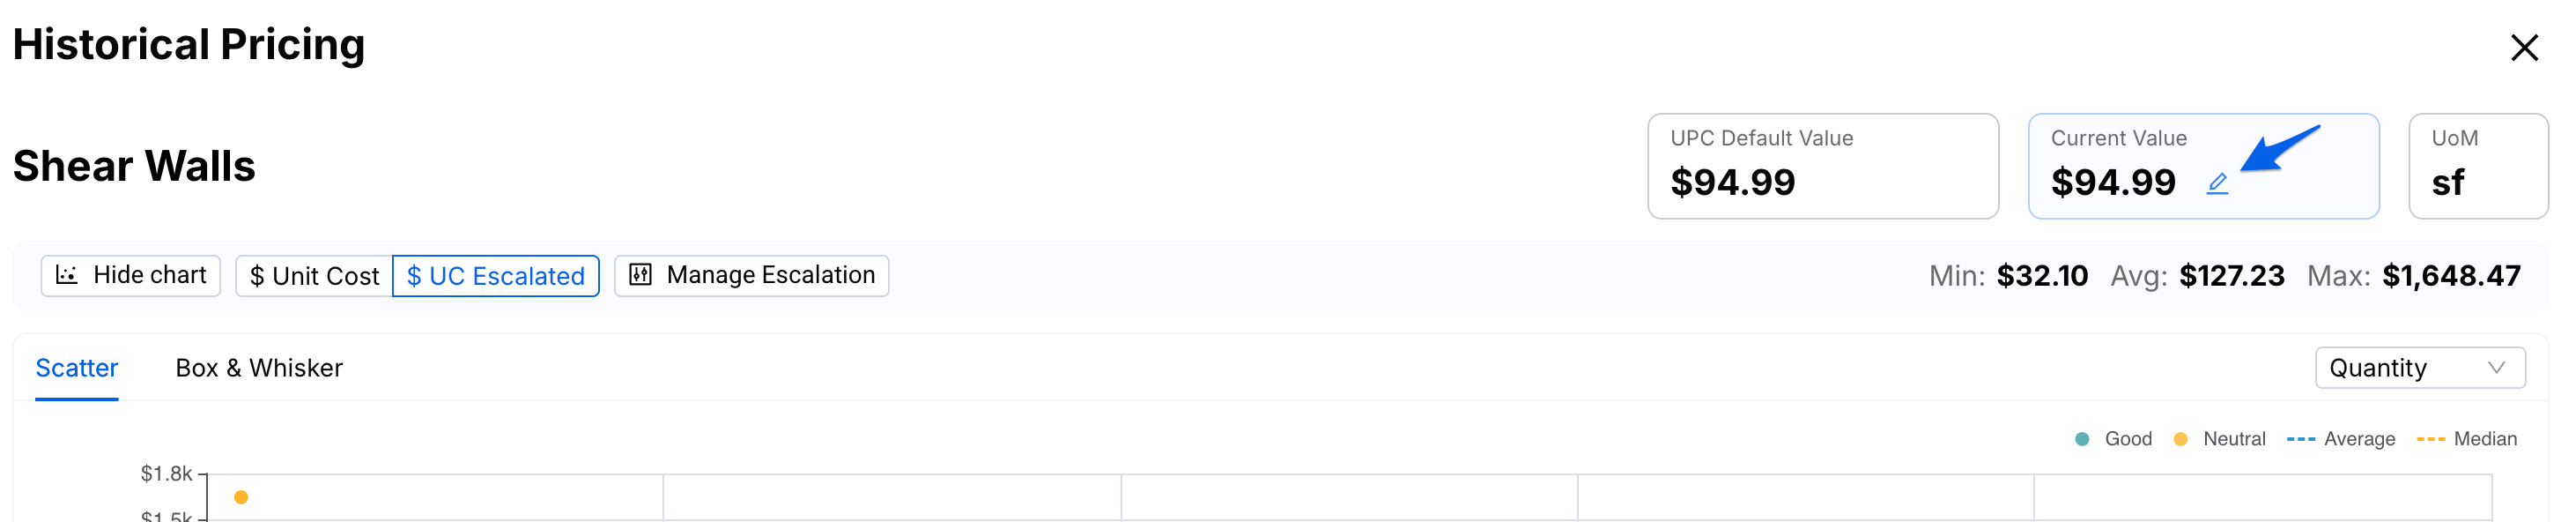
Enter your chosen unit cost by clicking the pencil icon next to Current Value.
-
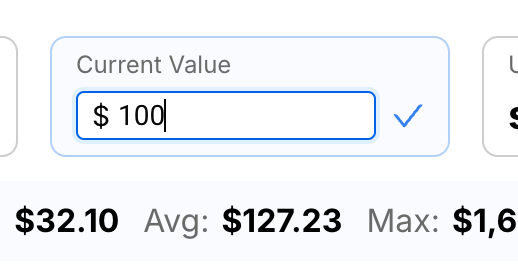
Adjust your Unit Cost, and click the checkmark (or press Enter).
- Close the modal; your line item will reflect the updated cost within your estimate.
FAQs
Why am I not seeing certain projects in the results?
A few things can cause this: the project may be archived, the line items may have mismatched UoMs, or the values may be zero, negative, or text-based. All of these are filtered out automatically to keep your historical data clean.
Do my filters carry over to the next line item I look up?
No; filters reset each time you open the modal on a new line item. This is intentional to make sure you're always starting with a full, unfiltered dataset. Your column preferences and escalation settings, however, do persist.
Will my escalation settings apply across all my projects?
Yes. Any changes you make to escalation within the modal are saved to your User Settings and will apply across all projects you work in.
What's the difference between the escalated and original unit cost columns?
The escalated column shows the cost normalized to today's dollars and your current region, making it easier to compare apples-to-apples. The original column shows what the cost actually was at the time, without any adjustment.
Can I hide outliers?
Yes; you can hide individual rows that don't make sense for your analysis directly from the table by scrolling all the way to the right and clicking on the Hidden toggle.
If you have any further questions, feel free to contact our support team and we’ll be happy to help!