In-App Variance Reporting
In Ediphi, the Cost Trendline tells the story of how your project's costs have evolved over time; every Submission, your live Project Value, and your Milestone Target Values are combined into one interactive view. But sometimes seeing that costs changed isn't enough; you need to know exactly what changed, where, and by how much.
That's where our In-App Variance Reporting feature comes in. Built directly into the Cost Trendline, it lets you pick any two points in your cost story: two submissions, a submission and your live estimate (Project Value), or a Cost Model and a submission. Then, instantly see a full breakdown of the variance between them.
Because it lives inside the Cost Trendline, the In-App Variance Report shares the same location within the platform, the same grouping options, and the same permissions as the trendline itself, making it intuitive to use.
In this article
- Entering/Exiting Compare Mode
- Display Settings in Compare Mode
- Choosing What to Compare
- What the Variance Report Tracks
- Variance Report Chart
- Variance Report Table
- Permissions
- FAQs
Entering/Exiting Compare Mode
The In-App Variance Report lives inside the Cost Trendline on your project’s Overview page. When you open the Overview page, you're greeted by the Cost Trendline as usual, showing your submissions, your live estimate, and your Target Values.
To start comparing, click the Compare button at the top right of the Cost Trendline graph.

Once you're in Compare Mode, choose two points you want to compare within the trendline graph, and the Variance Report will build automatically at the bottom of the page once both are selected.
When you're finished, click Exit compare mode. This returns you to the standard Cost Trendline and SOV section, where you'll see the detailed data for whichever single submission, live estimate, or Cost Model is currently selected on the trendline.

Display Settings in Compare Mode
While you're in Compare mode, you'll have all the same display controls you have on the standard Cost Trendline. You can:
- Switch the trendline between $ Total and $ GSF.
- Show or hide Design Stages, the Cost Model, the Project Estimate (live dot), and Target Values.
- Filter the data by Submitted or Milestone Range.
- Manage the Cost Trendline (show/hide submissions and Cost Models), provided you have the required permissions.

Note: Managing the Cost Trendline while in Compare Mode follows the same permissions as managing it on the standard Cost Trendline.
Choosing What to Compare
Baseline and Comparison
A variance is always measured between two points: a Baseline (your starting point) and a Comparison (what you're measuring against it).
When you first enter Compare Mode, the Baseline is selected for you automatically:
- If you already had a point selected on the Cost Trendline before entering Compare Mode, that selection becomes your Baseline.
- Otherwise, the Baseline defaults to the furthest-most point on the trendline; typically your most recent estimate or your live Project Value.
With the Baseline set, click any other point on the Cost Trendline graph to set it as the Comparison. As soon as the Comparison is selected, the Variance Report loads at the bottom of the page.

Clearing and Changing Your Selection
You can re-pick your points at any time. Two controls make this easy:
-
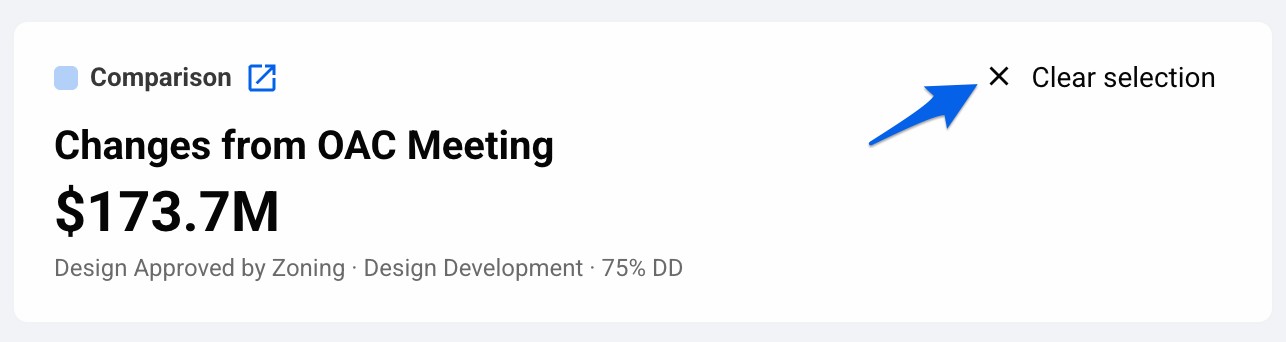
Clear selection (under the Comparison card) removes only the Comparison, leaving your Baseline in place so you can pick a different point to compare against.
-
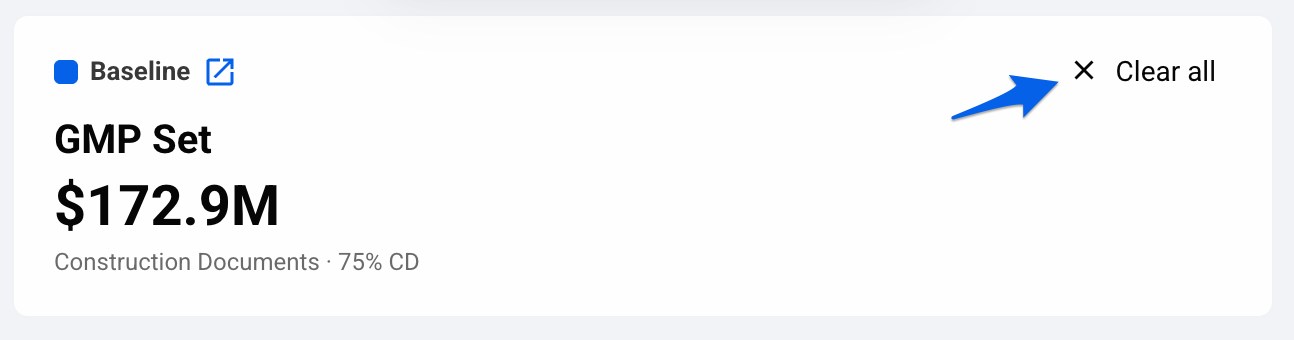
Clear all (under the Baseline card) removes both the Baseline and the Comparison, even if you already have a Comparison selected. This gives you a fresh slate.
Once everything is cleared, selection follows a simple rule: your first click sets the Baseline, and your second click sets the Comparison.
Note: The automatically selected Baseline can always be removed. If you want full control over both points, use Clear all and then select them yourself in order (Baseline first, Comparison second).
The Baseline and Comparison Cards
Below the Cost Trendline, two cards summarize the points you're comparing. Each card shows:
- The title/name of the point selected.
- The Milestone and Design Stage it belongs to.
- The Grand Total of that estimate.
Pro Tip: Depending on your permission level within the project, these cards also include a link that take you directly to the specific estimate or Cost Model being used as your Baseline or Comparison; handy for jumping into the source data behind a number.

What the Variance Report Tracks
The Variance Report is designed to answer one question clearly: what changed in cost between these two estimates? It is not to be considered an audit trail. With that in mind, a few important behaviors to know:
- The report only tracks changes to Quantity, Unit Cost, and Total. Changes to line item order, description, or other non-cost fields are not shown.
- A change to Unit of Measurement is only surfaced when it's accompanied by a change to quantity, unit cost, or total. On its own, a UoM change won't appear.
Pro Tip: The Variance Report tracks above-the-line markup pricing. Its Total column is based on the estimate's Total + column, and its Unit Cost column is based on the estimate's Unit Cost + column, not the plain Total and Unit Cost columns.
- If your estimates do not use above-the-line markups, the + columns match the standard columns, so the values line up exactly.
- If your estimates do use above-the-line markups, we recommend enabling the Unit Cost + and Total + columns in your estimates. That way, the numbers you see in your estimate match what the Variance Report is reflecting, and the difference is easy to reconcile.
For more on how above-the-line markups affect displayed costs, see Above The Line Markups.
Variance Report Chart
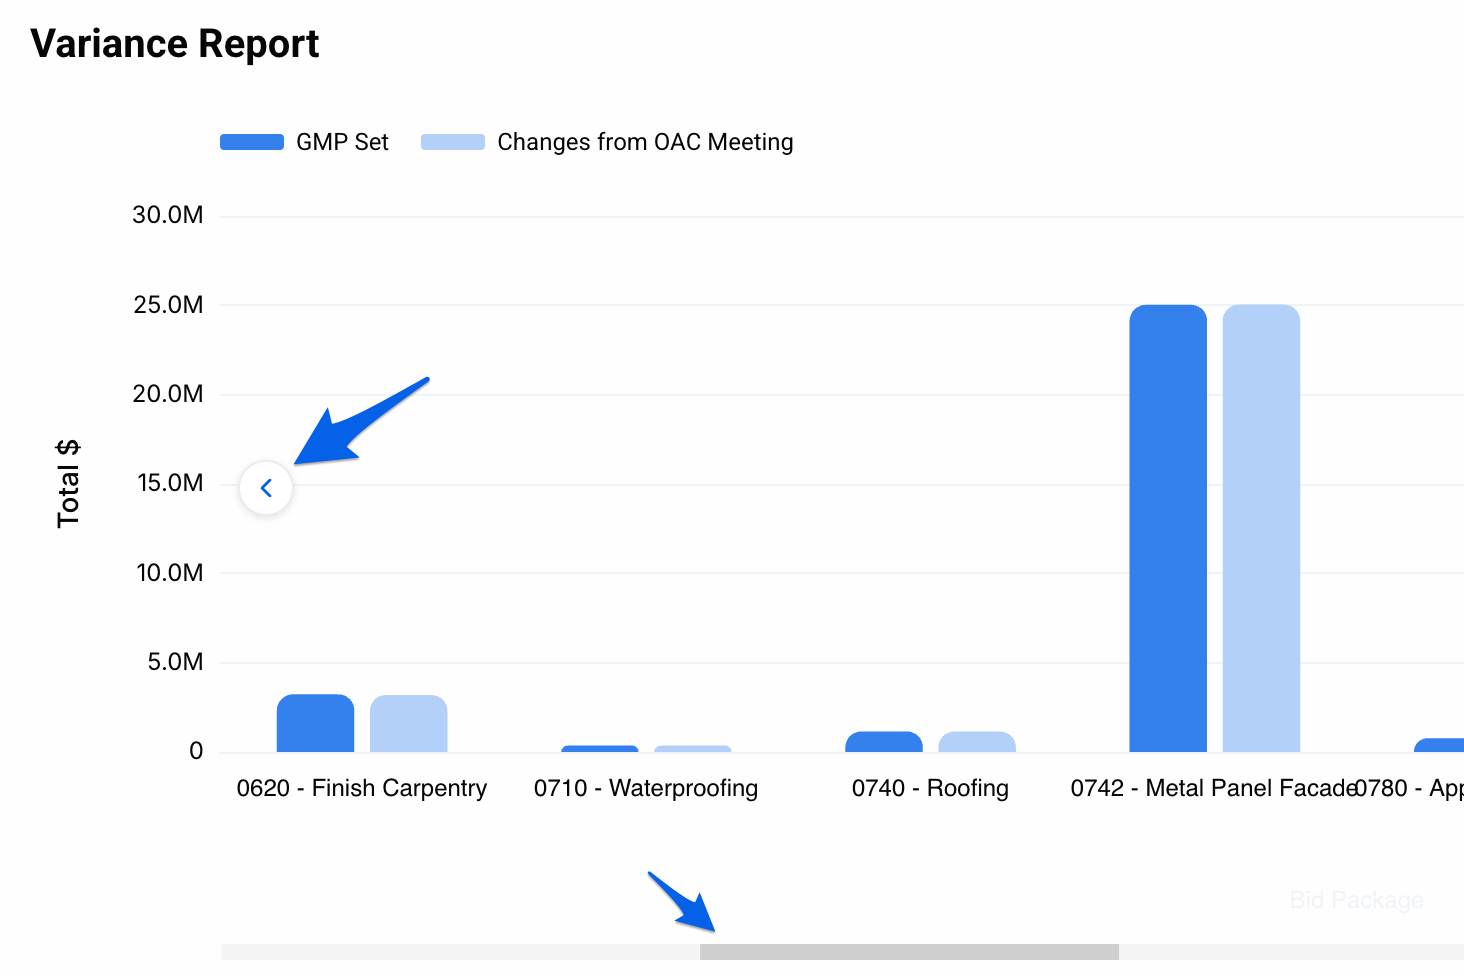
Once both points are selected, the first thing you'll see in the Variance Report is a chart. It works just like the Cost Trendline's SOV chart: it displays total cost broken down by your selected Grouping, showing two bars per grouping, one for the Baseline and one for the Comparison, so you can immediately spot where costs moved.

A few things you can do with the chart:
-
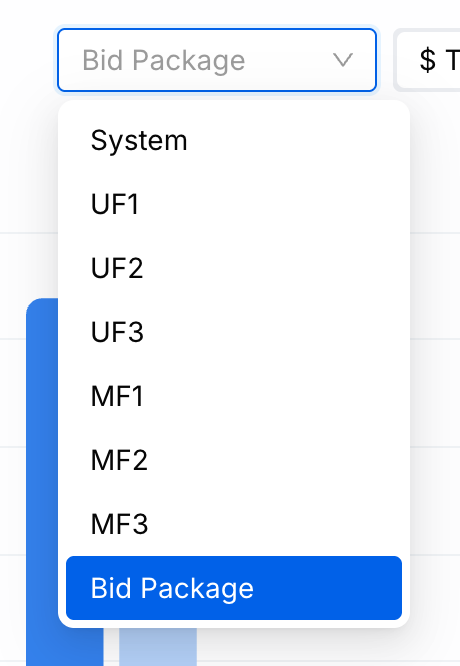
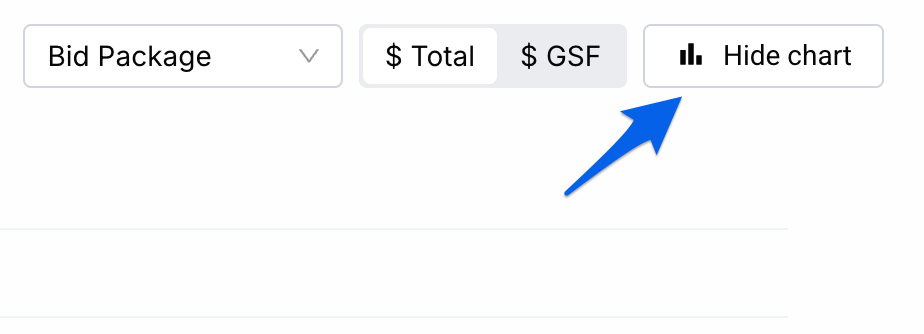
Change the grouping: Use the dropdown to switch between groupings such as Bid Package, System, MF1, UF2, and so on.
-
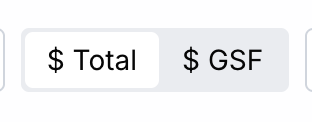
Toggle $ Total / $ GSF: Switch between total cost and cost per gross square foot, calculated on the same grouping.
-
Paginate through Groupings: Use the arrows (or the scroll bar) to scroll left and right through all your groupings. As you move between pages, the totals and GSF amounts in the graph update to reflect what's currently on screen.
-
Hide the chart: Click Hide chart to collapse it and free up screen real estate for the variance table below. Click Show chart to bring it back.
Note: The grouping options available here match exactly what's enabled on the Cost Trendline for this project. If you have custom sort fields enabled and your line items are sorted by them, those will appear as grouping options too. Whatever grouping you choose here also drives how the variance table below is organized.
Variance Report Table
Scroll past the chart and you're in the Variance Report itself. Think of it like a Schedule of Values (SOV): line items organized under their groupings, but with every relevant change surfaced between your Baseline and Comparison.
Quick Filters
At the top of the table are Quick Filters; the fastest way to focus on the changes you care about:
- All items: every line item, organized by grouping.
- Added: line items that exist in the Comparison but not in the Baseline.
- Edited: line items whose Qty, Unit Cost, or Total changed.
- Removed: line items that existed in the Baseline but not in the Comparison.
Toggle between these at any time to narrow the view.

Hide Unchanged Line Items
Note: This option is only available under the All items filter.
Directly under the Quick Filters is a Hide unchanged line items toggle, which is on by default. To keep the report readable, unchanged line items are hidden so you only see what actually moved.

If you turn the toggle off, the report will show how many exist within each grouping, giving you the full picture when you need it, however it will not reflect the specific line items that remained unchanged.

Columns
The table contains the following columns:
- Tag: the type of change applied to the line item: Added, Edited, or Removed.
- Description: the name of the line item under its grouping.
- Qty: Quantity.
- UoM: Unit of Measurement.
- Unit Cost: cost per unit of the line item.
- Total: total of the line item.
Note: By default, the Qty, Unit Cost, and Total columns are collapsed and show a single Delta value (the difference between Baseline and Comparison). The UoM column always displays the Baseline's unit of measurement and does not carry a delta.
Expanding Columns: Base vs. Comparison
You can expand Qty, UoM, Unit Cost, and Total to reveal the underlying values. When expanded, each column splits into:
- Base: the value on your Baseline estimate.
- Comparison: the value it changed to.
- Delta: the difference between the two.
This makes it easy to see not just how much something changed, but from what and to what.

Note: There is no delta for Unit of Measurement; only a Base and a Comparison. If a line item's UoM was changed as part of an edit (which isn't always the case), the report will show the new value, but there's no numeric delta to calculate for a unit of measurement.
Grouping Deltas
When you're in the All items filter, each grouping header shows the net delta for that group, the combined change across all its line items.
For example, with a Bid Package grouping selected, the Final Cleaning package below might show a net delta of ($845), meaning the edited line items under Final Cleaning add up to an $845 reduction.

Expand All/Collapse All
Two controls help you manage large reports:
-
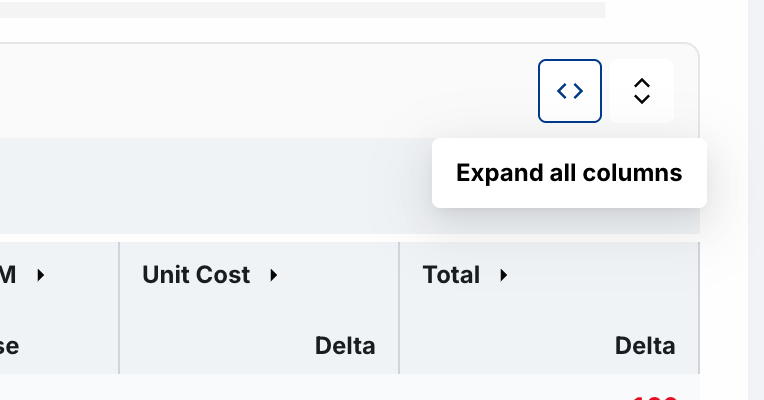
Expand/Collapse all columns opens/closes Qty, UoM, Unit Cost, and Total across the whole table at once (you can also expand/collapse them individually).
-
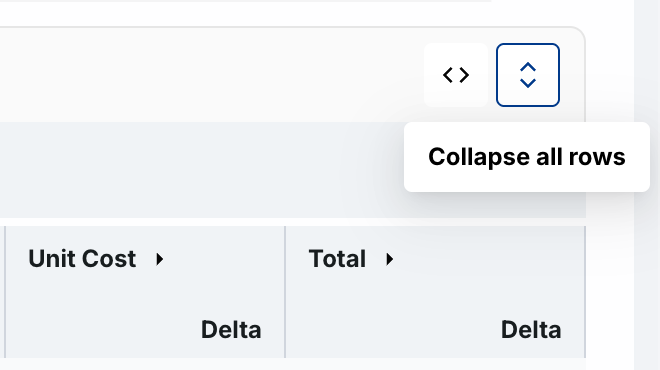
Collapse/Expand all rows collapses/expands every grouping, so you can then expand/collapse just the one you want to focus on.
Reading the Colors
The Variance Report uses color to make direction of change obvious at a glance:
Green (in parentheses): A negative delta. Because a cost decrease is effectively a savings, negatives are shown in green, wrapped in parentheses (e.g., (845)).
Red: A positive delta. An increase in cost is shown in red.
Grey: No change (a zero delta).
Black: Always used for the UoM.
Permissions
The In-App Variance Report is part of the Cost Trendline, so it inherits the same permission settings. Anyone who can view and interact with the Cost Trendline can enter Compare Mode and view the Variance Report, and any management actions (such as enabling Cost Models or managing submissions) require the same access they would on the trendline itself.
|
|
Global Admin | Project Owner | Member (Write - Cost Model + Estimates) | Member (Write - Estimates) | Member (Read - Estimates) |
|---|---|---|---|---|---|
| Enter Compare Mode / View Variance Report | ✓ | ✓ | ✓ | ✓ | ✓ |
| Change grouping, toggles & display settings | ✓ | ✓ | ✓ | ✓ | ✓ |
| Open source estimate/Cost Model via link | ✓ | ✓ | ✓ | ✓ | ✓ |
| Manage Cost Trendline (show/hide submissions) | ✓ | ✓ | ✓ | ✓ | ✗ |
| Enable/disable Cost Models on the trendline | ✓ | ✓ | ✓ | ✗ | ✗ |
For the full permission breakdown, see the Cost Trendline article.
FAQs
Where do I find the Variance Report?
It's built directly into the Cost Trendline on your project’s Overview page. Click the Compare button at the top right of the trendline graph to enter Compare Mode, then select the two points you want to compare.
What can I compare against each other?
Any two points on your Cost Trendline: two submitted estimates, a submission and your Project Value, or a Cost Model against a submission. Whatever appears as a point on the trendline can serve as your Baseline or Comparison.
How is the Baseline chosen?
When you enter Compare Mode, whatever you had selected on the trendline becomes the Baseline. If nothing was selected, it defaults to the furthest-most point (usually your most recent estimate or Project Value). You can always change it using Clear all and re-selecting.
What's the difference between "Clear selection" and "Clear all"?
Clear selection (under the Comparison card) removes only the Comparison and keeps your Baseline. Clear all (under the Baseline card) removes both points so you can start over.
Why don't I see a delta on my grouping headers?
Per-grouping deltas only appear under the All items quick filter. Once you filter to Added, Edited, or Removed, the data is already narrowed to one change type, so the grouping delta is hidden.
Why are some line items missing from the report?
By default, Hide unchanged line items is turned on so the report only shows what changed. Turn the toggle off to include unchanged line items in the view. Note that this will only reflect the amount of unchanged line items; it will not display the actual line items that were left unchanged.
Why don't I see the changes I made to a line item's description (or its order)?
The Variance Report only tracks changes to Quantity, Unit Cost, and Total. It's a variance report, not an audit trail, so edits to description, order, or other non-cost fields aren't surfaced.
A line item's unit of measurement changed, but there's no delta. Why?
Unit of measurement has no numeric delta, only a Base and a Comparison value. A UoM change is also only shown when it comes with a change to quantity, unit cost, or total.
Why don't the Unit Cost and Total in the Variance Report match the Unit Cost and Total columns in my estimate?
The Variance Report tracks above-the-line markup pricing, so it reads from your estimate's Unit Cost + and Total + columns rather than the standard Unit Cost and Total columns. If you use above-the-line markups, enable the + columns in your estimate’s SOV so the numbers line up. If you don't use above-the-line markups, the columns should match.
What does the color coding mean?
Green (in parentheses) is a negative delta / cost savings, red is a positive delta / cost increase, grey is no change, and black is always used for the unit of measurement.
How do I get back to the normal Cost Trendline?
Click Exit compare mode. You'll return to the standard Cost Trendline and SOV view for whichever point is currently selected.
If you have any further questions, feel free to contact our support team and we'll be happy to help!